Key points:
- A split jet stream pattern will occur with the northern branch extending over a ridge stationed along the west coast (positive PNA signal). The southern branch will track through southern california, arizona,texas and east towards alabama, and georgia.
- Larger snowstorms will track along the east coast this year with a more active southern jet and the northern branch supplying colder air into the pattern.
- I expect phasing of the branches to occur especially in mid to late december and most of February with storms tracking further north along the east coast. Major strengthening of low pressure systems can occur with very warm water off the east coast.
- With the jet stream branches well to the north and south of the area the pacific northwest will remain dry and average warmer then normal this winter.
- The gulf coast and southeastern states will be wetter then normal with a strong
southern jet providing precipitation.
- The southwestern u.s will stay wet with higher elevation snows above normal.
- The midwest and northern plains can be drier then normal with large temperature swings especially in western parts of the midwest.
Zone Summary:
The east:
The northeastern part of the u.s will have better snowfall opportunities this year with phasing of the northern and southern branches. I expect snowfall to average above normal from the eastern great lakes all the way east to southern new england. Warmer then normal water off the east coast will allow for rapid strengthening systems and higher amounts of snow. The lake effect machine will be turned into high gear. With a cold december expected an early lake effect season will occur around the great lakes.The southeast can be wetter then normal especially early in the season as the southern jet will be the main source of precipitation, as is typical in an el nino year. An area from northern Georgia and Alabama, interior sections of the Carolinas up the Appalachians into eastern PA and NY will experience the highest snowfall compared to normal this year. Systems will track further west into the eastern or central lakes at times but the main track will stay further east along the apps or up the coast. This is why I have areas further west closer to average. Northern new england will have its fare share of snow this year and i believe a slightly above average snowfall season is in store for them. Some systems may track off the southeast coast especially when cold air is laking(weak northern branch) or excessive suppressing the storm track to the south. What may occur this season is northern branch features will track to the east off the northern new england coast and may redevelop causing 4-8” snowstorms that may surprise you and go above expectations. The gulf coast states as well as the southern plains will experience above average precipitation and cool conditions. The chance of a snow/ice storm is higher then normal this winter especially in areas that are a little further north away from the gulf.
The West and Rockies
The pacific northwest and northern rockies will stay dry and warmer then normal with the mean ridge position setting up along the west coast with a +PNA signal. Southern california, the Southern Rockies, Arizona and New Mexico will average cooler then normal with above average precipitation. Higher elevations will experience above normal snowfall including Denver, CO. An early start to the ski season is likely and should be watched out for. Cities like Tucson, Az should be on the watch for a snowfall event, which will be more likely to occur this winter with a more active southern jet and the cold air building to the north.
Central U.S and Great Lakes
The western Great Lakes and the Northern Plains will be dry this winter with clippers as there main source of snowfall. There will be little influence from the southern jet and major storms will tend to track to the east of the area. The northern plains will be normal to slightly warmer then normal with areas further east in the midwest experiencing more seasonal temperatures that will vary at times. Temperatures swings can occur across the midwest as the western ridge shifts to the east at times promoting a SW flow of air. Another possibility is a deeper trough further west setting up sometimes producing cooler temperatures across this area. In terms of snowfall weak el nino seasons are highly variable for the midwest. For example weak el nino seasons like 1976-77, 1977-78, were snowy seasons in the area but years like 1953-54,2006-07 and 1968-69 were well below normal for snowfall. I believe chicago can expect near normal snowfall as well as areas further east of there. Anywhere further north west of chicago(away from the lakes) will miss out on snowfall this year. Lake effect snow will be well above normal in areas downwind of the lakes especially in december as arctic air masses may plunge southwards very frequently. Because of very above normal lake temperatures, freezing of the lakes will be unlikely and late season lake effect will help up snow totals in many areas. I expect the great lakes area to average near normal but cities along the eastern lakes and/or effected by LES will average above normal with more apps runners moving northwards carrying snow on the NW side. Clippers will lay down swath’s of 1-3 and 2-5 inch snows but areas effected by the southern branch will cash in on much more snowfall this season.
Reasoning behind the forecast
ENSO:
Firstly a very important factor in this winter forecast is the positioning of the nino in the pacific. East based nino's are warm in the north and west and cooler in the southeast. Central or West based el nino’s are cold across the east and warm in the west.
East based nino’s:
West based ninos:
I am expecting a weak el nino this winter.
IRI forecast has it peaking out somewhere between 0.5 and 1.
Some people believe that this el nino is going to have trouble developing and might end up being a la nada winter. I think that the el nino is going to start strengthening this fall much like 2009. In 2009 we didn’t see very much development until october when the SOI values really began to crash. Notice how the SOI values stayed around zero for a few months, just like this year before falling in october. Despite the break in august and September I believe that the El Nino will be stronger soon with the daily SOI values falling.
2009 SOI values:
This year:
After a September break the last few days may be a precursor of whats to come in october...
QBO
What is the QBO? The Quasi-Biennial Oscillation (QBO) is a slow oscillation in the strength and direction of the zonal wind in the lower and middle stratosphere over the equator. It has a period of roughly 28-29 months (hence the 'quasi-biennial' title) and has been observed for more than 50 years now in climatological records. The alternating wind regimes develop at the top of the lower stratosphere and propagate downwards at about 1 km (0.6 mi) per month until they are dissipated at the tropical tropopause. Downward motion of the easterlies is usually more irregular than that of the westerlies. The amplitude of the easterly phase is about twice as strong as that of the westerly phase. At the top of the vertical QBO domain, easterlies dominate, while at the bottom, westerlies are more likely to be found. Negative (white) are easterly, positives (shaded) are westerly. Notice we are seeing an easterly phase of the QBO right now except between 50 and 70mb.
Current QBO chart:

The QBO is a huge factor when it comes to snowfall across the eastern U.S. Recent QBO values depict a negative state that in my opinion will hold through the winter. This will help to enhance blocking across high latitudes sending more widespread cold air across north america. Cities in the northeast such as New York and Boston tend to do better with snowfall totals in a westerly QBO el nino season. In east QBO el nino years northeast cities tend to be average to slightly above average in terms of snowfall. In east QBO el nino’s with an MEI between 0.0 and 0.5 NYC averages 25” of snow. Boston averages 45” of snow. Toronto averages 155cm of snow. In east QBO el nino years like 1968-69 and 1976-77 cities in the northeast and great lakes were much above normal for snowfall. Other easterly QBO years had more precipitation further southeast with a storm track out to sea off the southeast coast. I don’t think this storm track will occur frequently this winter but it may occur at times. Here's the correlation between an easterly QBO at 30mb and 500mb heights across the globe.

If the QBO ends up switching to a westerly phase a snowier winter but less cold will be felt in areas further north along the east coast and further west in the eastern great lakes/interior northeast. We tend to see more apps runners/coastal’s as opposed to out to sea storms that take a southern track. For snow lovers I don’t think that would be such a bad thing.
West QBO el nino’s in a cold PDO:
AVG snowfall in NYC with MEI between 0 and +1: 32”
Boston: 55”
Toronto:165cm
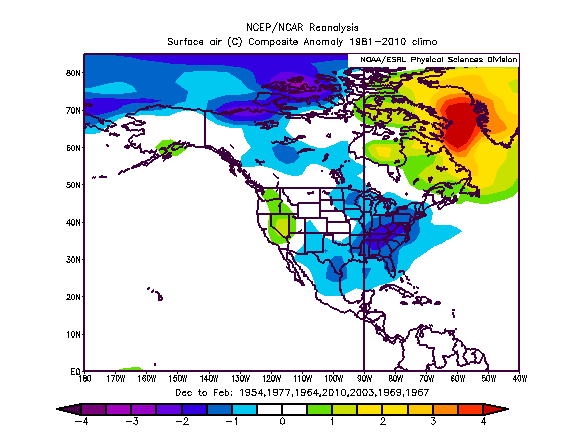
This is what east QBO el nino’s with a -PDO look like across North America. Notice the wide spread cold.
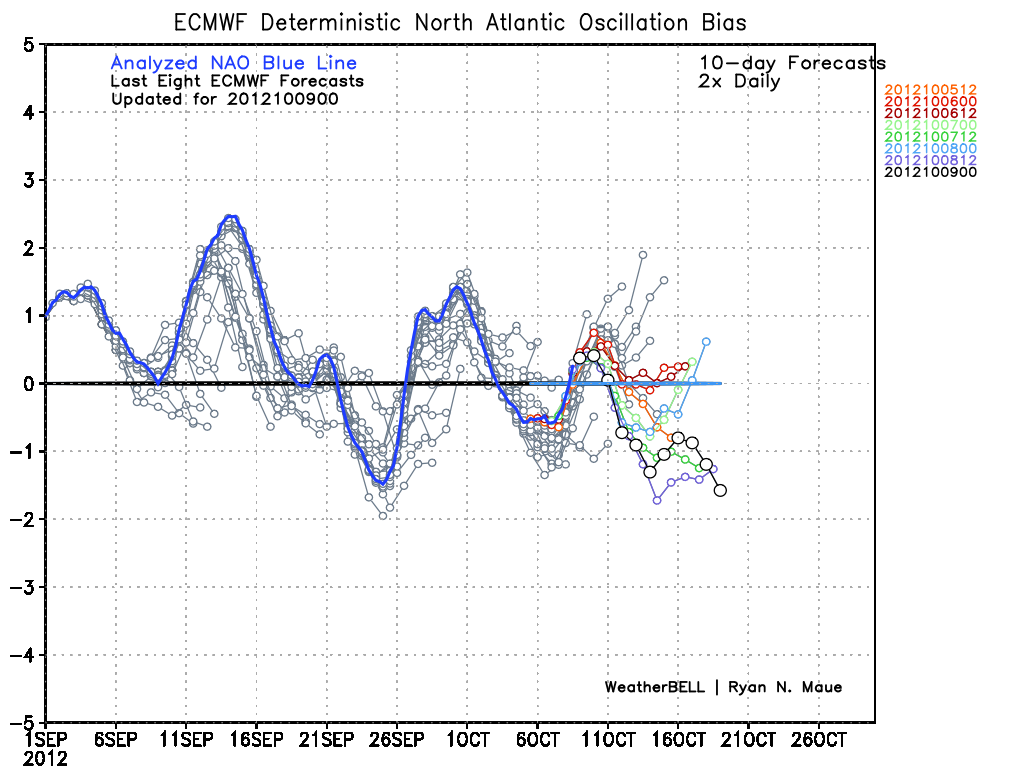
Another wild card this winter will be blocking which varies from week to week and month to month. It is very difficult to predict NAO and AO values far in advance but there are several factors that could influence these teleconnections which I will explain along with what is setting up this year.
Some factors include...
- A profound warm atlantic tripole (warm,cold, warm SST’s) helps to enhance blocking across Greenland. This was a major contributor to a very -NAO this summer. We can see that in the year of 2009-10 contributing to the strong persistent blocking that showed up.
Also in the winter of 1952-3 we can see the warm, cold then warm pattern setting up. This winter had consistent blocking for most of the fall, winter and spring.
1952 10 -0.28
1952 11 -1.32
1952 12 -0.49
1953 1 -0.12
1953 2 -1.00
1953 3 -0.45
1953 4 -1.96
: 90% of original size [ 565 x 437 ] - Click to view full image
Here is the correlation between SST’s and the NAO. Notice the warm AMO tripole. This is a very important factor.
Here are the temperature effects of the NAO state on various ENSO states. I think that we will see a mix of the -NAO La Nada and -NAO El nino temperature trends.
Effect of the AO and NAO on winter:
Taking a look at this years SST’s we can see a favorable pattern in the Atlantic starting to take place. Notice the very warm water near Greenland. That will be a very key factor in determining this years NAO state.
2) Solar activity
We know that years with low solar had strong blocking showing up. This year we are heading towards the solar maximum. The peak is expected to be sometime in 2013 with an estimated sun spot number at 76. The sun spot number is very low when compared to other solar max years. I don't feel as though there is a very strong effect that solar activity will have on this winter besides favouring the cold idea. I do not expect any big flare ups this winter unlike last winter when the sun was more active with some large solar flares mid season. This could have been responsible for some of the extreme warmth last winter. In el nino’s with high solar blow torch winter are common but just a few spots have been the normal in this very quiet cycle.
3) Volcanic activity
Years which arctic volcanoes erupted had very strong persistent blocking such as 2009-10. This also contributes to a big drop in global temperatures the following years. Due to the volcanos that recently erupted in 2009 we may see some strong cooling showing up this winter or the following winters as a result. In the year of 1912-13 we saw mount novarupta erupt and this produced major cooling 3,4 and 5 years later.
In the winter of 2009-10 we saw Mt. Redoubt in Alaska, Sarychev in Russia and Eyjafjallajökull in Iceland. If we do the math we can see that as history is shown to repeat itself we will see a lot of cold showing up in north america in the winters of 2012-13, 2013-14 and 2014-15.
4. Mid and upper level temperatures. Very cold mid and upper level temperatures like we saw last winter will force the bundling of the jet northwards(a stronger polar vortex) toward the poles and force the positive AO that we saw last winter! This is also why alaska, greenland and higher latitudes experienced a very cold winter. The reason for last winters very positive AO and NAO was the very cold mid and upper level temperatures that were present before and during the winter time. The mid and upper level temperatures have warmed up significantly this year which is why I believe that an overall -NAO/ AO pattern will setup this winter with a chance for much colder air masses to get locked into the east. In summary, with an east QBO, low solar activity, a warm AMO tripole and near normal temperatures in the stratosphere I believe that a negative NAO will be favoured this winter.
Analogs:
My analog years were chosen based on weak el nino seasons, east QBO’s, a negative NAO and AO, positive PNA, near normal to above normal stratospheric temperatures, a warm AMO tripole, a negative PDO, central based el nino’s coming off of a la nina. I also looked at years with similar summers, low solar and atlantic hurricane activity. Weak el nino’s tend to vary largely from year to year so I focused on other factors besides the ENSO trend. Here is a chart I made in order to help me construct my analog set and eliminate analog years that didn’t correlate as well. I listed all my potential analog years with all the indicies as well as 2012-2013 winter’s forecasted indicies.

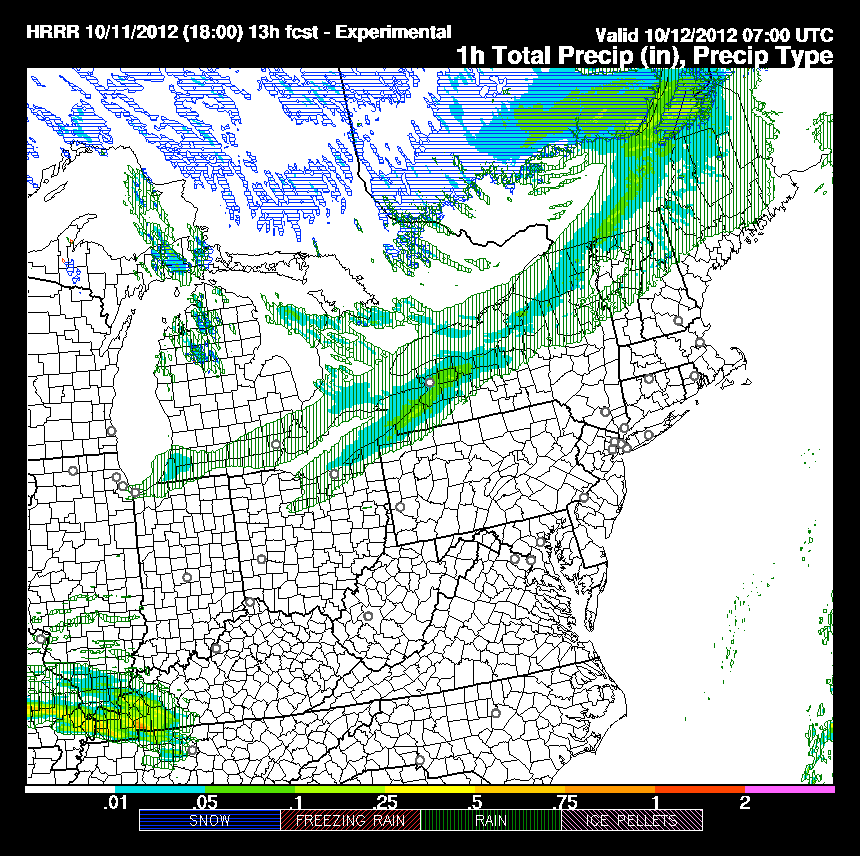
This winter I am expecting a positive PNA with a mean ridge centred along the west coast with a downstream trough over the great lakes. A mean ridge will form across greenland promoting a less progressive and more amplified pattern. Remember this is a mean pattern and is not something that will always hold. These troughs and ridges will shift east and west at times which is why the midwest and northern plains may experience large temperatures changes. As we get into mid to late december the northern branch will get stronger allowing for more phasing of the jet streams to occur. I see two periods that will stand out this winter, in terms of being the harshest. Mid to late december and most of february. In these periods more storms will move northward up the coast or inland. If november is cold across north america more snow cover will build up in NW canada allowing for colder air masses to move through earlier on in the season. Snowcover will be a very important factor this winter, one that should be watched closely going forward. Longer lasting cold shots will promote more LES and more phasing will cause larger snowstorms to form. If this scenerio plays out then colder air will grip the east earlier on and hang around for a longer time. Snowcover across high latitudes is already beginning to build and its only the beginning of october. Here’s the 8 day forecast in these areas. I believe that because of these reasons an early start to winter will be on the table this year.
Asia:
North America:
Northern Europe:
Now on to the best part, the final forecast!
Mean upper level pattern forecast for this winter:
I have a couple analog sets that I based this winter forecast off of:
1. Here is my main analog set for DJF:
These are my QBO analog years (east QBO,weak el nino’s)
Month to month forecast with analogs:
December:
The winter of 2012-13 will start off with a bang. I expect a colder then normal December overall with the action really getting going mid to late month. Phasing will have a good chance of ocurring with a west based -NAO block showing up, a ridge in the west and a cold southern and eastern U.S. Snowcover will build up this month setting the stage for a long lasting cold winter. I expect several storms to make a run up the east coast or the apps this month.
Analogs:
Forecasted Temperatures:
Precipitation and snowfall:
January:
The coldest anomalies will back off a bit this month but don’t be fooled slightly cooler then normal temps in January can be quite cold. Chilly air masses will move down from the arctic feeling frigid in the heart of winter. The snowpack will hold up this month but I expect more storms to move OTS this month. A less amplified ridge will shift to the west, more of a -PNA signal will show up will colder air across NW canada and the southeastern u.s. A more transient pattern will take place this month sharing the wealth of cold air. The pacific NW will stay warmer then normal with the influence of the ridge to there west but may get in on some more cold air masses. More widespread cold is expected in January. Clippers will allow for some snow to fall across the north but the snow machine will generally take a bit of a break this month.
Analogs:
Forecast:
February:
Winter will recharge and make a comeback in February as phasing begins to take place again and a more locked in pattern develops with a +PNA and negative NAO. Snowfall will average well above normal for the east coast with storms packing quite a punch as they track further north. Phasing of the jets will cause more frigid air to attack the east with little break. The worst of winter will be felt this month for the east and southeast. Ridging in the west will keep departures above normal.
Analogs:
Forecast:
DJF forecast:
Winter highlights:
I really hope you guys enjoyed my outlook. A lot of research and hard work was put into this! Feel free to post your thoughts, comments and any questions you have for me about this winter!


-2.jpg)
-1.jpg)


.gif)


.png)


.png)

.png)